Why are Weather and Climate Extremes Important?
Weather and Climate Extremes are one of the biggest challenge for society. They lead to loss of human life and induce damages to the global economy and infrastructure. Hence understanding what they are, how they develop and change as well as how we can adapt to them is crucial.
Examples of their impacts include the following
- Loss of Human Life: Approximately 17.200 people lost their life globally due to extreme events (according to data of Munich Re). The 10-year average of fatalities is at 17.800 people.
- Biological Limits: Nature can adapt to gradual change but extreme events (like storms) can damage entire ecosystems (e.g. forests), causing permanent biodiversity loss.
- Damage to Infrastructure Most infrastructure (dams, power grids, bridges) is built to withstand “normal” limits. Extremes push systems past their breaking points, leading to cascading failures.
- Economic Shocks: A single extreme event, like a catastrophic hurricane, can significantly decrease the economic growth of a nation or cause global supply chain collapses.
There are several types of extreme events that can be related to different climate variables such as temperature, precipitation or wind. Some examples of extreme events are listed here
- Heatwaves
- Cold Waves
- Heavy Precipitation
- Droughts
- Storms
Since I currently investigate Storms in my PhD we will use Storms as an example in this article.
What is the Difference Between Weather and Climate Extremes?
The difference between weather and climate lays in the temporal dimension. While weather refers to short-term (days, weeks) states of our atmosphere and oceans, climate is related to long-term patterns (years, decades, centuries).
Similarly climate extremes refer to the long-term changes of weather extremes by looking for instance at the shifts in decadal frequency and intensity of weather extremes. Weather extremes on the other hand refer to the immediate extreme events or so called natural hazards.

How Can We Describe Extreme Events?
According to the IPCC extreme events can be characterized by the following attributes
- Intensity and Magnitude: Describes how the proxy-variable for the extreme event changes over time. Often the intensity measure of an event is used to define an event as extreme - for instance by exceeding a certain number of the intensity measure. This is also called a hazard threshold.
- Frequency: Describes how often the extreme event occured in a given time-frame.
- Duration: Measures how long an extreme event persists.
- Timing: Describes when an event happens.
- Spatial Extent: Describes where (geographically) the event happens.
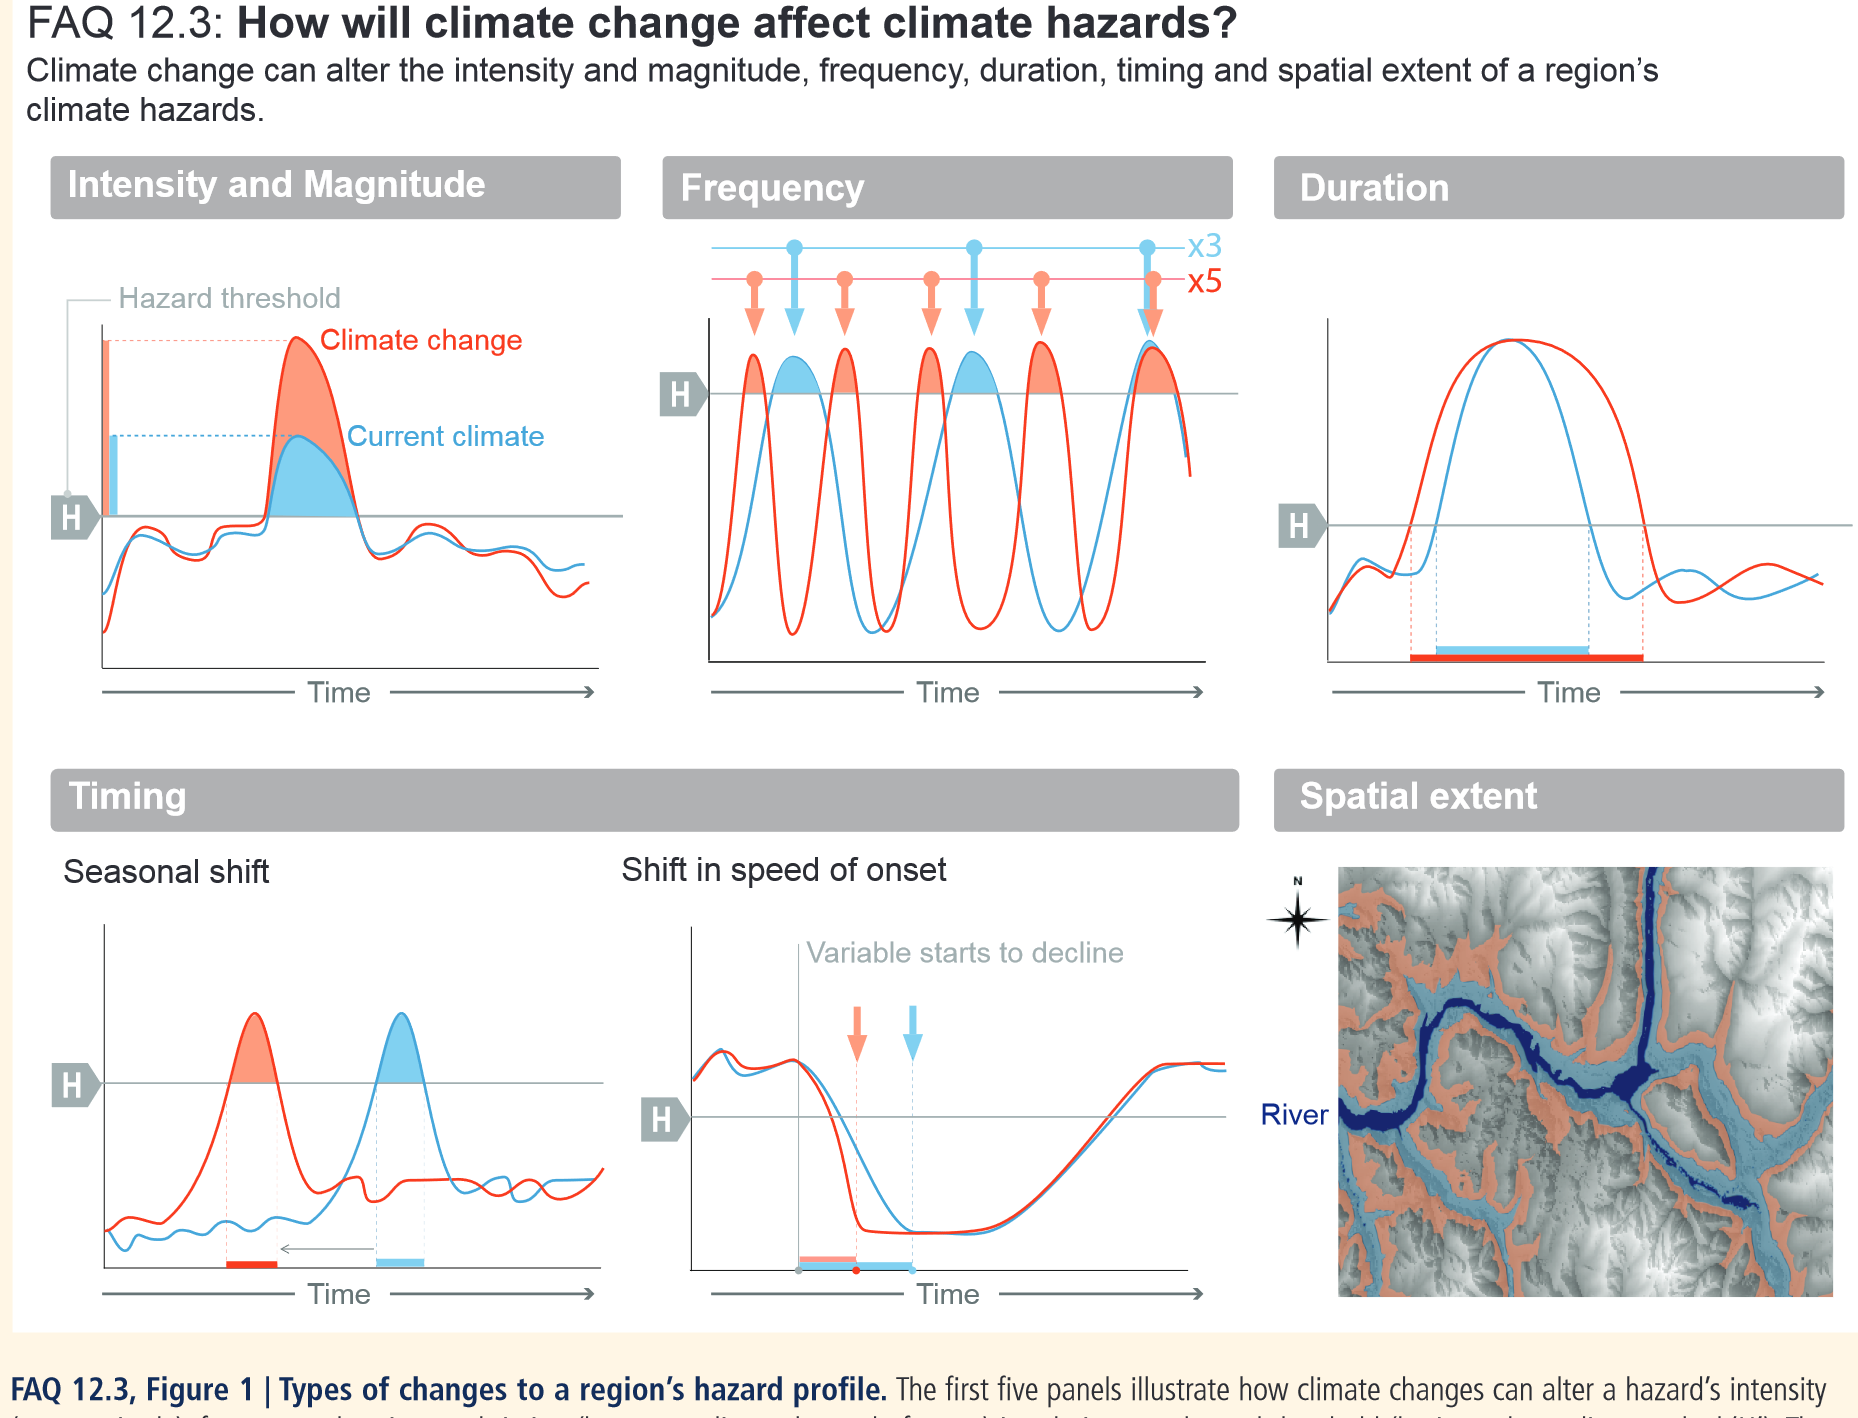
These attributes are visualized in the figure below.
Extreme Event Attributes of a Storm
Let’s look at each of those from the perspective of storms.
Intensity & Magnitude: The intensity of a storm can be measured by the current wind speed at a specific location. It describes how strong the storm is right now. The magnitude of a storm describes how large the overall change in the wind speed variable was during the whole event. Wind speed is just one example to measure the storms intensity & magnitude. Another possible variable would be to use the mean sea level pressure. Both variables, wind speed or mean sea level pressure, can be used to define storm events. One such example is the Saffir-Simpson-Scale, which classifies storms into 5 categories based on their wind speed.
Frequency: If we count how often storms are hitting the European coastline in an extended winter season (e.g. between the months Oct-Mar) we call it a frequency. Suppose there are 20 storms hitting the entire coastline, the observed frequency then is 20 storms / season. Another way to measure the frequency is in terms of statistical Return Periods. They measure how often a storm event is re-occuring. For instance a storm with a return period of 100 years occurs once (statistically) in a time frame of 100 years.
Duration: Storms can travel at different speeds. While fast traveling storms do not stay in location for a long time (short duration), slow storms can sit over a location for multiple days (long duration). It is important to see that it is not only the intensity of the storm that can lead to damages but also its duration. A storm of low intensity but long duration can be more damaging than a storm of high intesity and small duration.
Timing (Seasonal): Speaking for storms in the Northern Hemisphere, they often occur in the extended winter season (between October - March). Knowing this timing (in this case the seasonality of storms) is crucial when planning for adaptation or managing the emergency risks.
Timing (Speed of Onset): This refers to how much more quickly an extreme event reaches its peak intensity once it has formed.
Spatial Extent: Storms can have different spatial size ranging from localized tornadoes having a diameter of 3 km to extratropical cyclones which are ~480km wide. Knowing this spatial extent and being able to predict the exact location of where the storm hits is a very important information for emergency management.
How Can a Change in Climate Influence Extreme Events?
Each of the extreme event attributes can shift due to several factors and one of the is (human induced) climate change. Let us understand how each of the attributes can change by looking at Fig. 2 again. This image compares a blue curve (the current climate) to a red curve (the expected change of the attribute under climate change). How could this look like for storms?
Intensity & Magnitude: Suppose in the current climate storms are defined by a hazard threshold (the grey dashed line in Fig. 2) of wind speed exceeding 120 km/h. Every day where we measure wind speeds above this threshold is considered a stormy day. The blue shaded area then shows the magnitude of the storm event in the current climate and the blue line shows the corresponding intensity of the event at each point in time (e.g. day or hour). Under climate change the intensity can increase, leading to a shift of the blue line up to the red line. In other words; if it was “normal” in the current climate that the intensity of a storm was around 150 km/h, this “normal” intensity might shift upwards to 180 km/h. In total this increase in intensity might also lead to a larger magnitude (red shaded area) of the storm.
Frequency: There can also be a shift in the frequency of storms due to climate change. For instance they could occur more often as it is indicated in Fig. 2 by a shift from the blue to the red line (Note: literature suggests that storm-frequency is acutally decreasing globally, but they are getting more intense). You can see that the red line exceeds the hazard threshold more often.
Duration: Storms can persist longer in one location. Comparing the blue and red line in Fig. 2 this shows as a widening of the blue line resulting in the red line. In other words; the hazard threshold is exceeded for a longer time-period. You would get distributions like this if you compare fast storms (blue curve) and slow storms (red curve). If the storms duration decreases the resulting curve would be more narrow than the blue one.
Timing (Seasonal Shift): We already noted that the frequency of storms is supposed to decrease globally - but does this also mean that time when they hit shifts? Lets suppose this is the case and the stormy season does not start in October anymore but rather in August. This would result in a shift of the timing to the left, e.g. from the blue to the red curve.
Timing (Shift in Onset): The speed at which the peak intensity decreases or increases can be altered due to climate change. In Fig. 2 for example the hazard intensity of the current climate decreases more slowly (blue curve) than in a changed climate (red curve). Most recent storms (such as Hurricane Otis in 2023 and Hurricane Milton in 2024) seem to jump across categories of the Saffir-Simpson-Scale more rapidly than older storms. A possible explanation for this is an increase in the oceans temperature, which fuels storms.
Related Articles
If you want to know how these attributes are changing for storm events according to recent literature read the article below: